Company
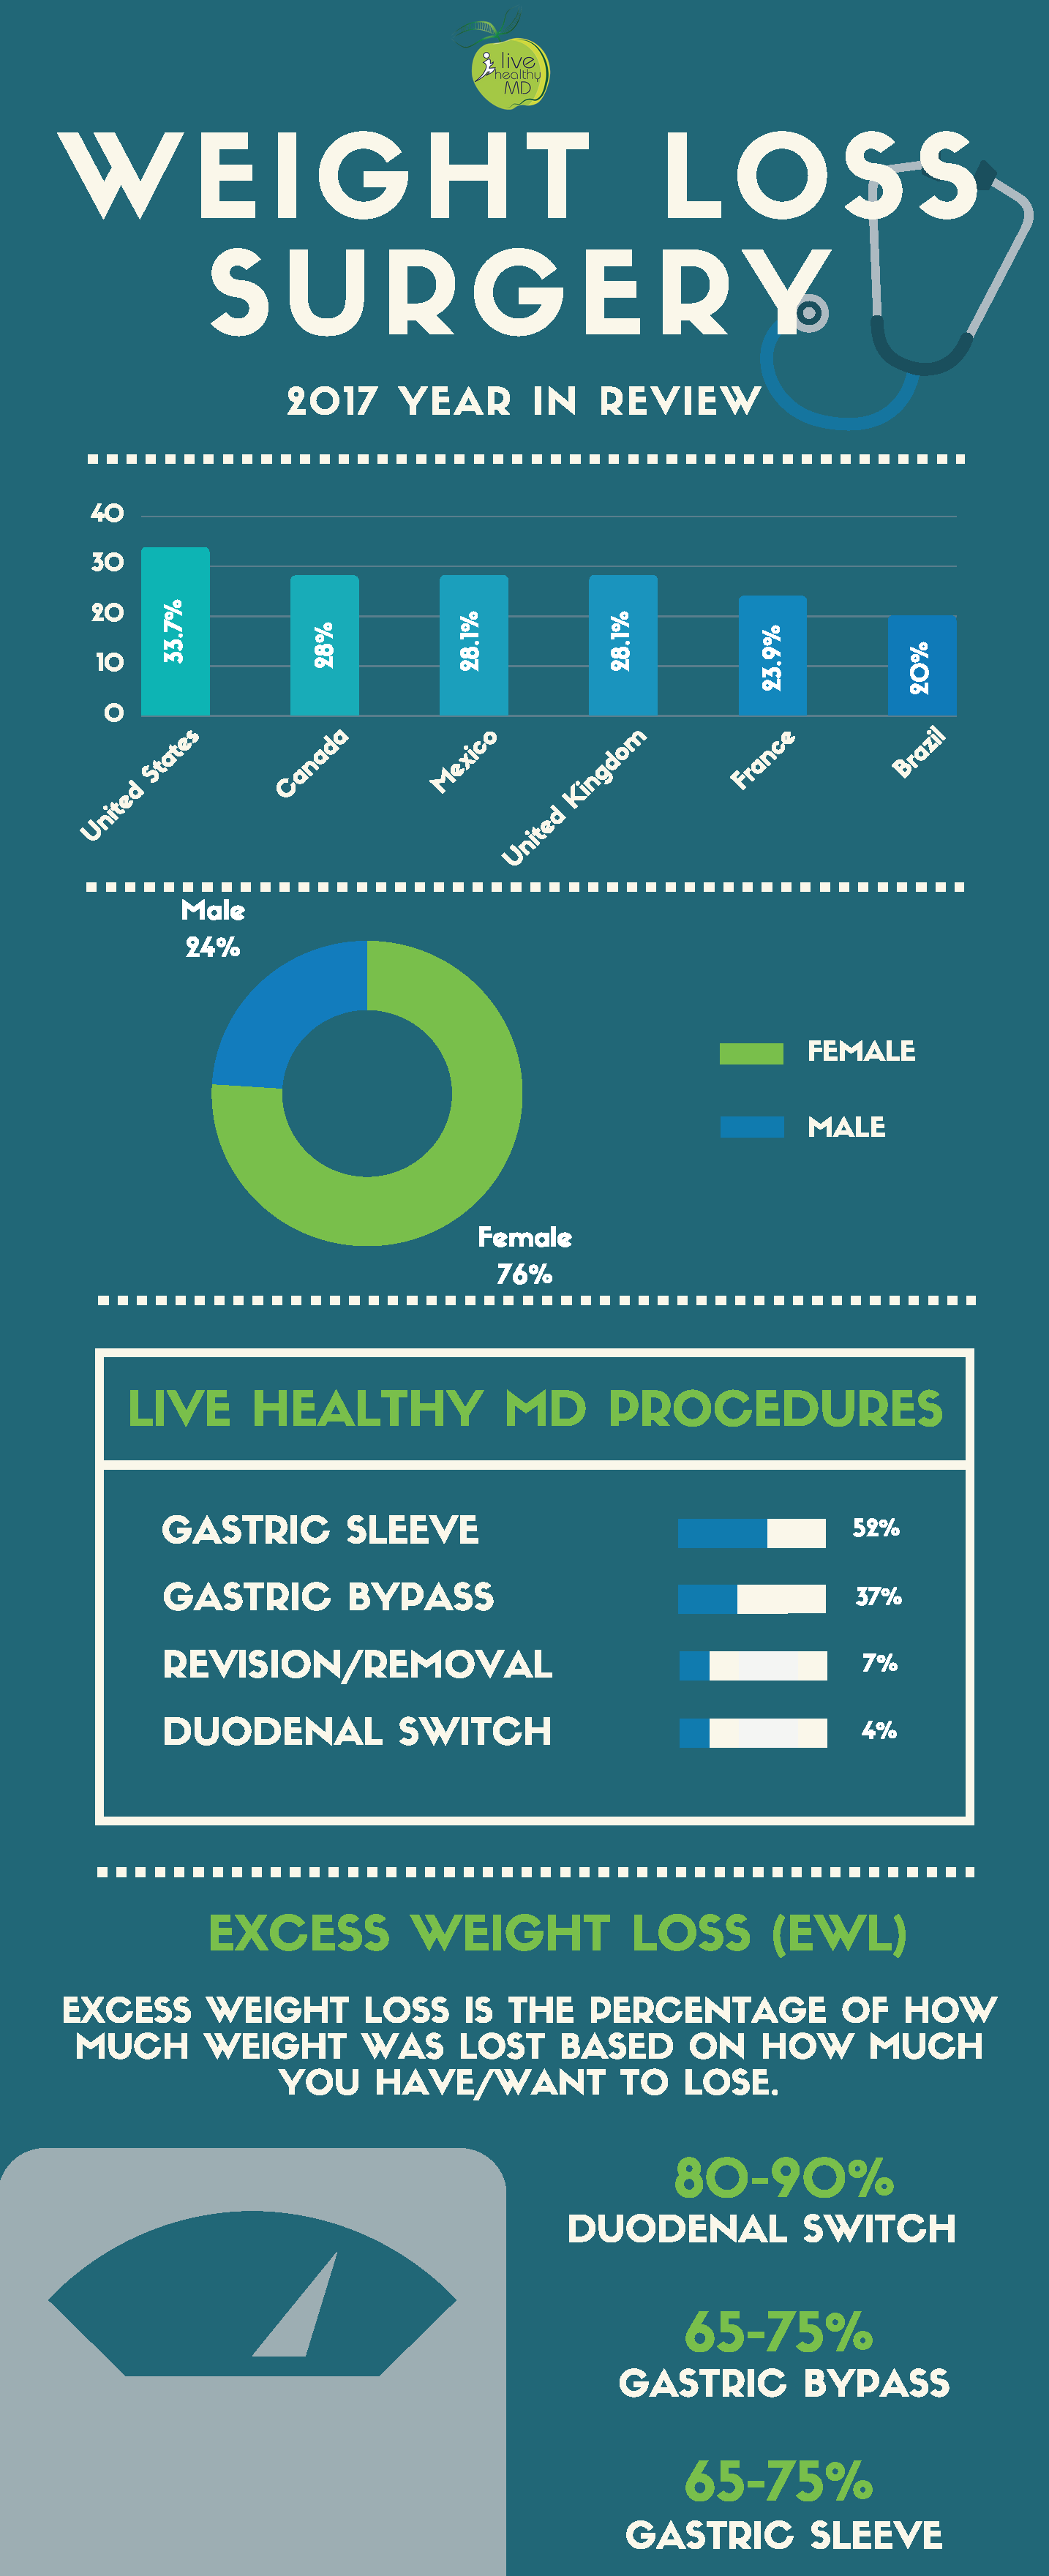
Year In Review: Surgery Statistics

As the obesity rate continues to rise in America and in other parts of the world, the prevalence of bariatric surgery has significantly risen as well. Dr. Jacome and I wanted to take a look back at the last year that shaped our practice and added to our professional experience. This infographic displays the surgical statistics in the world and at Live Healthy MD within 2017.

 How To Interpret This Information:

  1. The first graph is a depiction of the obesity rates as a percentage of the country's population.
  2. The pie chart shows the world's gender breakdown as it relates to who is having weight loss surgery.
  3. The table illustrates the percentage of each type of procedure our practice performed last year.
  4. Finally, the numbers at the bottom detail an approximate   weight loss expected from each procedure , defined as (starting weight) - (goal weight) = excess weight  (i.e.:  if you're 200 lbs and the goal is to be 100 lbs, then the patient has 100 lbs of excess weight.

If you would like to read more about our practice and experience level, visit our page on Obesity Help

LHMD Surgery Stats.png


TAKE THE NEXT STEP
See if this is right for you.
Schedule a Consult